
RFM
library(ggplot2)
library(tidyverse)
options(scipen = 9)commerce <- read.csv("data.csv")
str(commerce)## 'data.frame': 541909 obs. of 8 variables:
## $ InvoiceNo : chr "536365" "536365" "536365" "536365" ...
## $ StockCode : chr "85123A" "71053" "84406B" "84029G" ...
## $ Description: chr "WHITE HANGING HEART T-LIGHT HOLDER" "WHITE METAL LANTERN" "CREAM CUPID HEARTS COAT HANGER" "KNITTED UNION FLAG HOT WATER BOTTLE" ...
## $ Quantity : int 6 6 8 6 6 2 6 6 6 32 ...
## $ InvoiceDate: chr "12/1/2010 8:26" "12/1/2010 8:26" "12/1/2010 8:26" "12/1/2010 8:26" ...
## $ UnitPrice : num 2.55 3.39 2.75 3.39 3.39 7.65 4.25 1.85 1.85 1.69 ...
## $ CustomerID : int 17850 17850 17850 17850 17850 17850 17850 17850 17850 13047 ...
## $ Country : chr "United Kingdom" "United Kingdom" "United Kingdom" "United Kingdom" ...We change the data type for the date and the custumerID, fo other variables seem correct.
commerce$InvoiceDate <- lubridate::mdy_hm(commerce$InvoiceDate)
commerce$InvoiceDate <- as.Date(commerce$InvoiceDate, format = "%m/%d/%Y %H:%M")
commerce$CustomerID <- as.character(commerce$CustomerID)We should get rid of units that are worth less than zero, and is not in store, as well as no customers without and ID.
commerce <- commerce %>%
filter(UnitPrice > 0 & Quantity > 0 & !is.na(CustomerID))skimr::skim(commerce)| Name | commerce |
| Number of rows | 397884 |
| Number of columns | 8 |
| _______________________ | |
| Column type frequency: | |
| character | 5 |
| Date | 1 |
| numeric | 2 |
| ________________________ | |
| Group variables | None |
Variable type: character
| skim_variable | n_missing | complete_rate | min | max | empty | n_unique | whitespace |
|---|---|---|---|---|---|---|---|
| InvoiceNo | 0 | 1 | 6 | 6 | 0 | 18532 | 0 |
| StockCode | 0 | 1 | 1 | 12 | 0 | 3665 | 0 |
| Description | 0 | 1 | 6 | 35 | 0 | 3877 | 0 |
| CustomerID | 0 | 1 | 5 | 5 | 0 | 4338 | 0 |
| Country | 0 | 1 | 3 | 20 | 0 | 37 | 0 |
Variable type: Date
| skim_variable | n_missing | complete_rate | min | max | median | n_unique |
|---|---|---|---|---|---|---|
| InvoiceDate | 0 | 1 | 2010-12-01 | 2011-12-09 | 2011-07-31 | 305 |
Variable type: numeric
| skim_variable | n_missing | complete_rate | mean | sd | p0 | p25 | p50 | p75 | p100 | hist |
|---|---|---|---|---|---|---|---|---|---|---|
| Quantity | 0 | 1 | 12.99 | 179.33 | 1 | 2.00 | 6.00 | 12.00 | 80995.00 | ▇▁▁▁▁ |
| UnitPrice | 0 | 1 | 3.12 | 22.10 | 0 | 1.25 | 1.95 | 3.75 | 8142.75 | ▇▁▁▁▁ |
DataExplorer::plot_intro(commerce)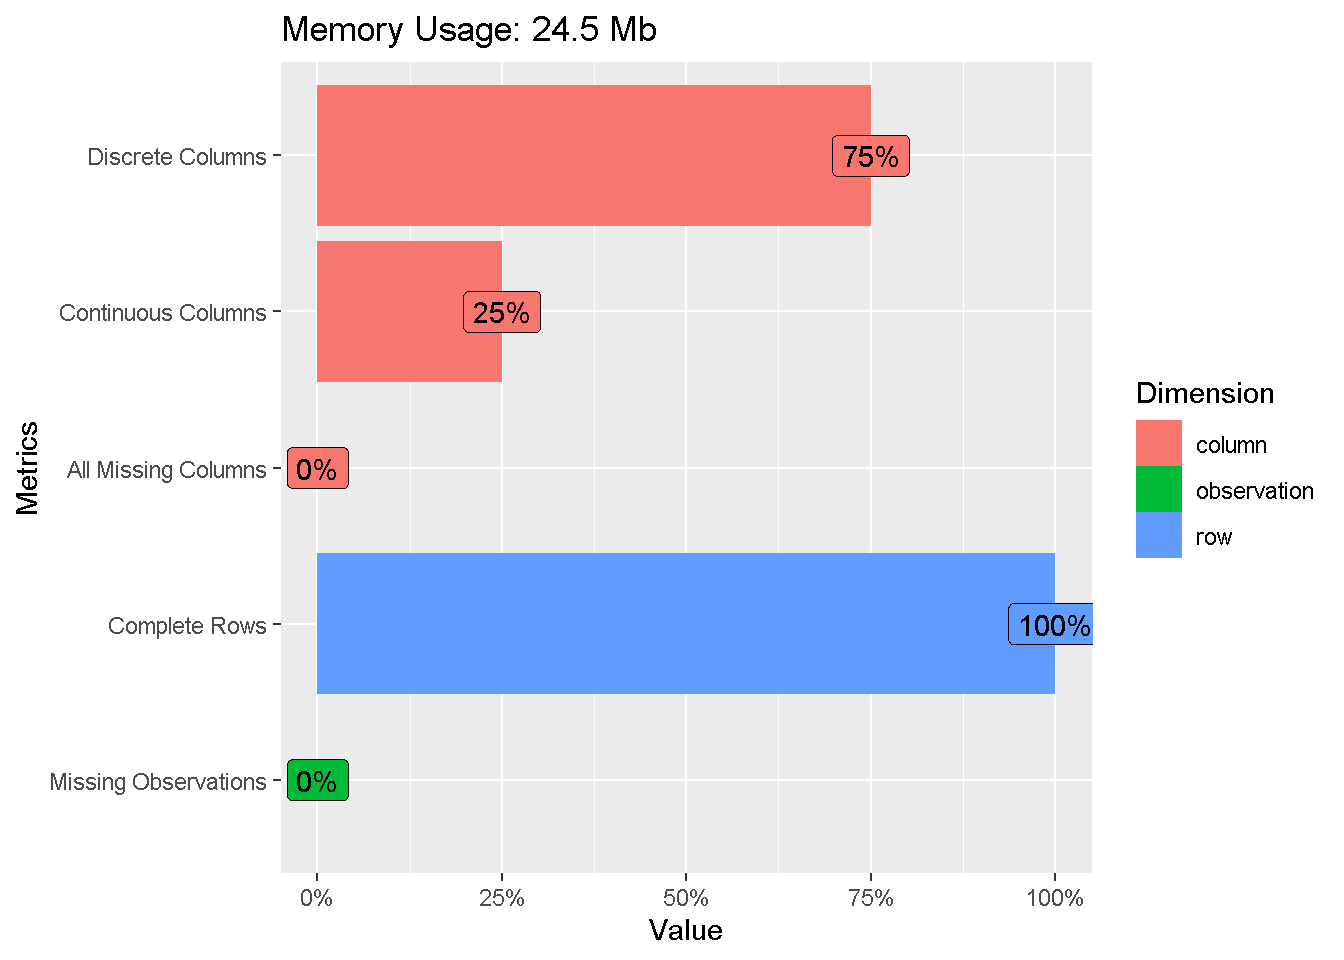
commerce <- commerce %>%
group_by(CustomerID) %>%
mutate(spending = UnitPrice * Quantity) %>%
ungroup()commerce %>%
arrange(desc(spending)) %>%
reactable::reactable(compact = T)